
Introduction: Unveiling Atlanta Electricals Ltd – A Powerhouse in Transformer Manufacturing
Atlanta Electricals Ltd, a veteran in the capital goods sector with over 36 years of expertise, is currently in the spotlight with its initial public offering (IPO). As a leading manufacturer of power, auto, and inverter-duty transformers, Atlanta Electricals Ltd is poised to capitalize on India’s surging demand for electricity infrastructure, grid modernization, and renewable energy integration. This Atlanta Electricals Ltd IPO, which opened on September 22, 2025, and is set to close on September 24, 2025, offers investors a chance to tap into a company with robust financial growth, a diversified product portfolio, and strong ties to government utilities. In this comprehensive review, we’ll dive deep into the Atlanta Electricals Ltd fundamentals, financials, sector outlook, risks, and more to help you decide if this is a worthwhile addition to your portfolio. Whether you’re searching for “Atlanta Electricals Ltd share price” insights or “Atlanta Electricals Ltd IPO” this guide has you covered.
As a stock market analyst at ProDataTraders.com, I’ve analyzed numerous IPOs in the capital goods and power sectors. Atlanta Electricals Ltd stands out due to its impressive revenue CAGR of 19.3% over FY23-25, backed by capacity expansions and a hefty order book of ₹1,643 crore – over 1.3 times its FY25 revenue. But is the valuation at 49x P/E justified?
Company Overview: From Humble Beginnings to a Transformer Titan
Founded in 1988, Atlanta Electricals Ltd (AEL) has evolved into one of India’s prominent manufacturers of transformers, specializing in power, auto, inverter-duty, furnace, generator, and special-duty variants. Headquartered in Gujarat, the company operates five manufacturing facilities (four active) across Anand, Vadodara, and Bengaluru. Over the years, AEL has delivered more than 4,400 transformers with a cumulative capacity of 94,000 MVA, serving 208 customers across 19 states and 3 union territories as of March 31, 2025.
What sets Atlanta Electricals Ltd apart is its strategic expansion. In FY25, the company’s installed capacity stood at 16,740 MVA, with a utilization rate of 98.3%. Post the commissioning of a new plant in Vadodara and the acquisition of BTW-Atlanta Transformers India Private Limited, capacity has skyrocketed to 63,060 MVA. This move not only enhances production efficiency but also allows AEL to venture into high-capacity transformers up to 500 MVA / 765 kV, opening doors to premium market segments like ultra-high voltage (UHV) applications.
The company’s customer base is diversified yet concentrated on reliable players. Key clients include Gujarat Energy Transmission Corporation Limited (GETCO), Adani Green Energy Limited, and Tata Power. In FY25, 65.8% of revenue came from government tenders, underscoring AEL’s strong position in public sector projects. Additionally, 22.63% involved related-party transactions, which, while efficient, pose some risks we’ll discuss later.
Raw material sourcing is predominantly domestic (~97% in FY25), including copper, electrical steel, and transformer oil. This reduces forex exposure and aligns with India’s “Make in India” push. Atlanta Electricals Ltd is also eyeing global markets and emerging sectors like data centers and EV infrastructure, positioning it for long-term growth amid India’s energy transition.
To illustrate the operational scale, here’s a table summarizing the capacity and utilization of AEL’s key facilities as of March 31, 2025:
| Facility | Installed Capacity (MVA) | Actual Production (MVA) | Capacity Utilization (%) |
|---|---|---|---|
| Gujarat Unit-I | 9,360 | 10,926 | 116.7% |
| Gujarat Unit-II | 6,660 | 5,447 | 81.8% |
| Karnataka | 720 | 80 | 11.1% |
| Total | 16,740 | 16,453 | 98.3% |
This high utilization rate reflects efficient operations and demand strength. Post-acquisition, the added Ankhi facility contributes 15,780 MVA, further bolstering capabilities.
Product Portfolio: A Diverse Range Tailored for Modern Needs
Atlanta Electricals Ltd‘s product lineup is comprehensive, catering to utilities, industries, and renewables. The portfolio includes:
- Power Transformers: Used for stepping up/down voltage in substations. Major customers: Government transmission companies and private substations.
- Auto Transformers: Connect grids at different voltages. Key clients: State-run utilities.
- Inverter Duty Transformers: For solar/wind energy, handling high overloads with low noise.
- Furnace Transformers: Power smelters in steel, copper, and aluminum industries. Capacities up to 50 MVA / 66 kV.
- Generator Transformers: Step up voltage from generators.
- Special Duty Transformers: Custom solutions for railways, labs, ports, etc.
Here’s a detailed table of the product portfolio:
| Product Type | Description | Key Applications | Major Customers |
|---|---|---|---|
| Power Transformers | Static device for voltage step-up/down via electromagnetic induction. | Power generation, transmission, distribution | Government T&D companies, private substations |
| Auto Transformers | Single winding for primary/secondary, interconnecting voltage levels. | Electrical substations | Government utilities |
| Inverter Duty Transformers | High-efficiency for renewables, overload capacity, low noise/vibration. | Solar plants, wind farms | Renewable energy entities |
| Furnace Transformers | High-current for smelting furnaces. Up to 24 pulses, 50 MVA / 66 kV. | Steel, copper, aluminum production | Private smelters |
| Generator Transformers | Step up generator output voltage. | Power plants | Utilities and industrials |
| Special Duty Transformers | Custom for unique needs like traction, rectifiers, shore-to-ship. | Labs, railways, ports, electrochemical | Government labs, private specials |
This diversity mitigates risks from any single segment. In FY25, power transformers dominated revenue at 73.6-75%, followed by auto (11%) and inverter-duty (10%). Allied products and project engineering services contributed the rest.
Revenue Mix and Order Book: Strong Visibility Ahead
Atlanta Electricals Ltd’s revenue mix in FY25 highlights its focus on core transformers:
- Power Transformers: 75%
- Auto Transformers: 11%
- Inverter Duty Transformers: 10%
- Revenue from Project Engineering Services: 2%
- Allied Products: 2%
Total revenue: ₹1,204 crore
The order book as of March 31, 2025, stood at ₹1,643 crore, providing 1.3x revenue visibility. Breakdown:
- Government and Public Sector Entities: 82% (₹1,349 crore)
- Private Entities: 18% (₹294 crore)
This government-heavy mix (66% of FY25 revenue) ensures stability but exposes to policy changes. The order book has grown from ₹534 crore in FY23, reflecting execution efficiency and market demand.
IPO Details: Size, Pricing, and Allocation
The Atlanta Electricals Ltd IPO is a mix of fresh issue and offer for sale (OFS), aiming to raise ₹687 crore at the upper band.
| Particular | Details |
|---|---|
| Issue Date | September 22-24, 2025 |
| Price Band | ₹718-₹754 per share |
| Bid Lot | 19 shares |
| Total Issue Size | ₹687 crore |
| Fresh Issue | ₹400 crore |
| OFS | ₹287 crore |
| Post-Issue Shares | 7.69 crore |
| Post-Issue Market Cap | ₹5,797 crore (upper band) |
| P/E (FY25) | 48.9x |
Allocation:
| Category | Allocation (%) | Size (₹ crore) |
|---|---|---|
| QIB | 50% | 343 |
| NII | 15% | 103 |
| Retail | 35% | 241 |
| Total | 100% | 687 |
Lead managers: Motilal Oswal Investment Advisors Ltd, Axis Capital Ltd. Registrar: Link Intime India Pvt Ltd. Listing on BSE and NSE, expected on September 29, 2025.
Objects of the Issue: Strategic Use of Proceeds
The net proceeds from the fresh issue (₹400 crore) will be utilized as follows:
| Object | Amount (₹ crore) | FY26 Utilization | FY27 Utilization |
|---|---|---|---|
| Repayment/Prepayment of Borrowings | 79 | 79 | – |
| Funding Working Capital Requirements | 210 | 118 | 92 |
| General Corporate Purposes | To be determined | – | – |
This allocation aims to strengthen the balance sheet by reducing debt (current D/E 0.4x to 0.2x post-IPO) and supporting working capital for order execution. The OFS proceeds go to selling shareholders, including promoters and others.
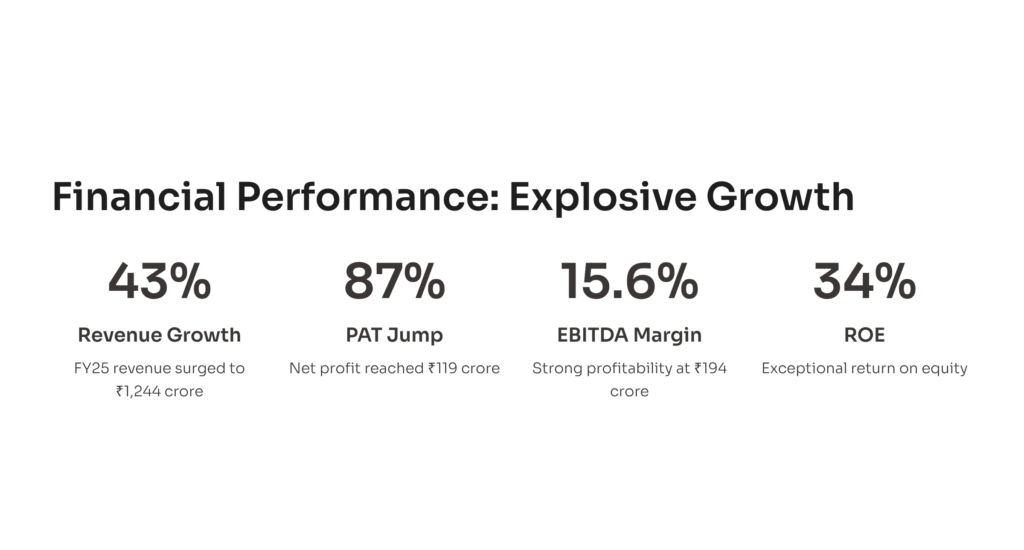
Financial Performance: Robust Growth and Healthy Margins
Atlanta Electricals Ltd has shown impressive financial traction. Revenue grew at 19.3% CAGR from FY23-25, EBITDA at 17.4%, and PAT at 16.4%. Let’s dissect the key statements.
Profit and Loss Statement:
| Particulars | FY23 (₹ crore) | FY24 (₹ crore) | FY25 (₹ crore) | YoY Growth FY24 (%) | YoY Growth FY25 (%) |
|---|---|---|---|---|---|
| Revenue from Operations | 874 | 868 | 1,244 | -0.7% | 43.3% |
| Other Income | 3 | 4 | 6 | – | – |
| Total Income | 877 | 872 | 1,250 | -0.6% | 43.3% |
| Cost of Raw Materials | 706 | 676 | 861 | -4.2% | 27.4% |
| Changes in Inventories | (68) | (40) | 55 | – | – |
| Employee Benefits | 17 | 22 | 29 | 29.4% | 31.8% |
| Finance Costs | 28 | 30 | 34 | 7.1% | 13.3% |
| Depreciation & Amortization | 5 | 5 | 6 | 0% | 20% |
| Other Expenses | 78 | 92 | 105 | 17.9% | 14.1% |
| Total Expenses | 766 | 785 | 1,090 | 2.5% | 38.9% |
| Profit Before Tax | 110 | 87 | 160 | -20.9% | 83.9% |
| Tax Expense | 23 | 24 | 41 | 4.3% | 70.8% |
| Net Profit | 87 | 63 | 119 | -27.6% | 88.9% |
Key takeaways: FY25 saw a 43% revenue jump due to capacity expansion and order execution. EBITDA margin improved to 16.1% from 14.2% in FY24, reflecting better cost management. PAT surged 89% YoY, driven by operational leverage.
Balance Sheet:
| Particulars | FY23 (₹ crore) | FY24 (₹ crore) | FY25 (₹ crore) |
|---|---|---|---|
| Property, Plant & Equipment | 44 | 62 | 69 |
| Capital Work in Progress | 3 | 12 | 113 |
| Financial Assets | 16 | 9 | 10 |
| Other Non-Current Assets | 6 | 7 | 18 |
| Trade Receivables | 260 | 180 | 352 |
| Inventories | 187 | 239 | 215 |
| Other Current Assets | 45 | 50 | 89 |
| Total Assets | 561 | 559 | 866 |
| Total Equity | 165 | 228 | 350 |
| Borrowings | 73 | 49 | 141 |
| Other Non-Current Liabilities | 3 | 3 | 6 |
| Trade Payables | 279 | 238 | 310 |
| Other Current Liabilities | 41 | 41 | 59 |
| Total Equity & Liabilities | 561 | 559 | 866 |
The balance sheet strengthened with total assets up 55% in FY25, fueled by capex (CWIP ₹113 crore). Equity rose 54%, while borrowings increased temporarily for expansion. D/E ratio at 0.4x remains healthy.
Cash Flow Statement:
| Particulars | FY23 (₹ crore) | FY24 (₹ crore) | FY25 (₹ crore) |
|---|---|---|---|
| Net Cash from Operating Activities | 52 | 88 | 84 |
| Net Cash from Investing Activities | (18) | (36) | (141) |
| Net Cash from Financing Activities | (31) | (55) | 57 |
| Net Change in Cash | 3 | (3) | 0 |
Operating cash flows are positive, but heavy investing outflows in FY25 reflect capex. Financing inflows in FY25 covered debt for growth.
Key Ratios:
| Ratio | FY23 | FY24 | FY25 |
|---|---|---|---|
| EBITDA Margin (%) | 16.4% | 14.2% | 16.1% |
| ROCE (%) | 58% | 42.3% | 39.4% |
| ROE (%) | 53.1% | 27.8% | 33.9% |
| Net Working Capital Days | 57 | 67 | 65 |
| Debt/Equity (x) | 0.4 | 0.2 | 0.4 |
| Current Ratio (x) | 1.6 | 1.8 | 1.9 |
AEL boasts industry-leading ROE (33.9%) and ROCE (39.4%), indicating efficient capital use. Margins are stable, with receivable days improving to 78 in FY25.
Revenue concentration is a watchpoint: Top 10 customers contributed 74.2% in FY25, top 5 at 61.1%, and largest at 29.1%. Power transformers dominate at 73.6%.
Sector Outlook: Booming Demand in Transformers
India’s transformer market is on an upward trajectory, driven by power demand, renewables, and infrastructure. The market grew at 10.4% CAGR from 2019-23 and is projected at 6-7% CAGR to 2030. Global market CAGR is ~7.43% for 2024-30.
India’s Transformer Market Size (USD Billion):
| Voltage Class | CY24E | CY25P | CY28P | CY30P |
|---|---|---|---|---|
| <66 kV | 2.44 | 2.64 | 3.21 | 3.54 |
| >66 kV to <230 kV | 2.93 | 3.15 | 3.74 | 4.07 |
| >230 kV to <765 kV | 0.43 | 0.47 | 0.58 | 0.65 |
| >765 kV | 0.14 | 0.16 | 0.23 | 0.27 |
| Total | 5.94 | 6.42 | 7.76 | 8.53 |
Source: CRISIL Report
Specialty transformers (inverter, furnace, rectifier) are growing faster, from $450 million in CY24 to $967 million by CY30.
India’s Specialty Transformer Market (USD Million):
| Category | CY24E | CY25P | CY28P | CY30P |
|---|---|---|---|---|
| Furnace Transformers | 115 | 138 | 225 | 306 |
| Rectifier Transformers | 45 | 53 | 88 | 120 |
| Inverter Transformers | 82 | 97 | 153 | 203 |
| Others | 138 | 162 | 255 | 338 |
| Total | 380 | 450 | 721 | 967 |
Growth drivers include renewable investments (e.g., solar/wind needing inverter transformers) and industrialization (furnace for metals). Government initiatives like “Make in India” and National Manufacturing Mission in Budget 2025 boost demand. Per capita electricity consumption up 50% in a decade, with renewables targeting 500 GW by 2030.
Atlanta Electricals Ltd is well-positioned, with inverter-duty focus aligning with green energy push. However, imports for high-tech specialties pose competition.
Competitive Landscape: How Does Atlanta Electricals Ltd Stack Up?
AEL competes with established players like Transformers and Rectifiers India Ltd (TRIL) and CG Power. Here’s a peer comparison (FY25 figures):
| Company | Market Cap (₹ cr) | Revenue (₹ cr) | EBITDA Margin (%) | PAT Margin (%) | ROCE (%) | P/E (x) |
|---|---|---|---|---|---|---|
| Atlanta Electricals Ltd | 5,797 | 1,244 | 16.1 | 9.5 | 39.4 | 48.9 |
| Transformers and Rectifiers Ltd | 15,613 | 2,019 | 16.2 | 10.7 | 28.6 | 59.7 |
| CG Power and Industrial Solutions Ltd | 1,23,502 | 9,909 | 13.2 | 9.8 | 39.9 | 123.2 |
| Voltamp Transformers Ltd | 7,450 | 1,934 | 18.9 | – | 22.1 | 25.7 |
AEL’s ROCE (39.4%) rivals CG Power, while its P/E (48.9x) is lower than TRIL (59.7x) and CG (123.2x), suggesting relative value despite premium pricing. Order book/sales at 1.3x beats Voltamp’s 0.6x but lags TRIL’s 2.5x. AEL’s D/E (0.4x) is prudent, post-IPO expected at 0.2x.
Promoter Background and Shareholding: Experienced Leadership
Promoters hold 94.4% pre-IPO, reducing to 87% post-IPO. Key promoters:
- Niral Krupeshbhai Patel (45): Chairman & MD, 22+ years in transformers, oversees strategy.
- Amish Krupeshbhai Patel (43): Whole-time Director, 17+ years in real estate/investments.
- Tanmay Surendrabhai Patel (48): Whole-time Director.
OFS sellers include Jignesh Suryakant Patel (36.4% of OFS) and Atlanta UHV Transformers LLP (11.4%).
Board includes 4 independent directors, ensuring governance.
Risks: Potential Headwinds for Atlanta Electricals Ltd
No investment is risk-free. Key risks:
- Geographical Concentration: ~44% revenue from Gujarat; disruptions could hurt.
- Government Dependence: 66% from state utilities; policy shifts or delays in tenders.
- Product Concentration: 74% from power transformers.
- Customer Concentration: Top 10 at 74%; loss of key clients like GETCO/Adani.
- Industry Threats: Raw material volatility (copper/steel prices), forex fluctuations, regulatory changes, competition from unorganized players.
- Valuation Risks: 49x P/E premium; market corrections could impact listing.
Social media sentiments echo this – some X users call valuations “crazy,” while others praise the order book. Analysts like Vibhor Varshney compare it favorably to peers but rank it below GK Energy in priority.
SWOT Analysis: Strengths vs. Challenges
Strengths:
- Diversified portfolio and customer base (208 clients).
- High ROE/ROCE, strong order book for visibility.
- Capacity expansion to 63,060 MVA.
- Domestic sourcing reduces costs.
Weaknesses:
- Heavy reliance on Gujarat (44% revenue) and government (66%).
- Customer concentration risks.
Opportunities:
- India’s transformer market growth (6-7% CAGR to 2030).
- Renewables boom (inverter-duty demand).
- Exports and EV/data center segments.
- “Make in India” incentives.
Threats:
- Raw material price volatility.
- Intense competition (TRIL, CG Power).
- Regulatory compliance burdens.
- Economic slowdowns affecting infra spending.
Overall, strengths outweigh weaknesses, with opportunities in green energy aligning with national goals.
Valuation Analysis: Premium but Justified?
At ₹754 (upper band), AEL is valued at 48.9x FY25 EPS, EV/EBITDA 30.7x, P/BV 16.6x. Compared to peers:
- Voltamp: 25.7x P/E, stronger margins but weaker order book.
- TRIL: 77.6x P/E, higher order book multiple.
- CG Power: 123.2x P/E, larger scale.
AEL’s premium reflects growth: 87% PAT jump, 1.3x order book, ROE 33.9%. Post-debt repayment, improved financials could justify it.
Should You Apply to Atlanta Electricals Ltd IPO?
Strengths like capacity expansion, sector tailwinds, and healthy ratios outweigh risks. With India’s power demand surging and renewables push, AEL could deliver 20-30% CAGR returns.
Conclusion: Power Up Your Portfolio with Atlanta Electricals Ltd?
Atlanta Electricals Ltd IPO represents a bet on India’s energy future. With solid fundamentals, strategic expansions, and positive market buzz, it’s appealing despite premium valuations. Stay tuned to ProDataTraders.com for updates. Invest wisely – markets are volatile!
Disclaimer: The views and investment tips expressed by experts on ProdataTraders.com are their own and not those of the website or its management. ProdataTraders advises users to check with certified experts before taking any investment decisions.
