
Introduction
ETERNAL LTD, the innovative powerhouse formerly known as Zomato Limited, is making waves in the stock market with its impressive financial performance and strategic insights revealed in the latest Q1FY26 earnings call. As of August 15, 2025, ETERNAL LTD’s stock price stands at ₹318.40, reflecting a 1.9% gain, signaling strong investor confidence amid a volatile market. This rebranded entity, listed on NSE under the symbol ETERNAL, has transitioned from its roots in food delivery to a broader ecosystem encompassing quick commerce via Blinkit, going-out services, and more. ETERNAL LTD’s journey highlights its adaptability in India’s rapidly evolving digital economy, where quick commerce and on-demand services are reshaping consumer behavior.
In this comprehensive analysis we’ll dissect ETERNAL LTD’s financial statements, technical indicators, performance metrics, and key takeaways from the July 21, 2025, earnings conference call. Drawing from detailed balance sheets, cash flow statements, profit and loss accounts, quarterly results, and the full transcript of the call, we’ll explore why ETERNAL LTD could be a prime investment opportunity. Whether you’re a seasoned trader or a novice investor, understanding ETERNAL LTD’s fundamentals is crucial in navigating the competitive landscape of e-commerce and delivery services. We’ll include data tables for clarity and delve into trends that could propel ETERNAL LTD’s stock further. Let’s dive in and uncover the potential behind this surging stock.
Company Overview
ETERNAL LTD, headquartered in New Delhi, India, operates as a leading technology platform connecting consumers with restaurants, grocery stores, and entertainment options. Originally founded as Zomato in 2010, the company rebranded to ETERNAL LTD to reflect its expanded vision beyond food discovery. Its core businesses include food delivery, quick commerce through Blinkit (acquired in 2022), Hyperpure (B2B supply chain for restaurants), and going-out services like dining reservations and event ticketing.
As of Q1FY26, ETERNAL LTD boasts a consolidated presence across India, with significant growth in quick commerce. Blinkit, the quick commerce arm, has expanded rapidly, adding stores and categories to cater to urban consumers’ demand for ultra-fast delivery. The company’s CIN is L93030DL2010PLC198141, and it’s listed on both BSE (Scrip Code: 543320) and NSE (Symbol: ETERNAL, ISIN: INE758T01015).
ETERNAL LTD’s strategic focus on inventory ownership in quick commerce, as discussed in the earnings call, positions it for margin improvements. Management, including CFO Akshant Goyal, Blinkit CEO Albinder Singh Dhindsa, and Head of Corporate Development Kunal Swarup, emphasized maintaining leadership amid competition. The rebranding underscores a commitment to long-term value creation, with innovations like 10-minute deliveries setting it apart.
Financially, ETERNAL LTD has shown robust growth. Total assets have ballooned from ₹8,704 crore in March 2021 to ₹35,861 crore in March 2025, driven by equity infusions and operational scaling. Revenue streams are diversified: food delivery contributes steadily, while quick commerce surges with 70% YoY growth in mature markets like Delhi. Challenges include competitive intensity and potential headwinds from GLP-1 drugs affecting food consumption, but management remains optimistic.
ETERNAL LTD’s market performance is stellar, outperforming benchmarks like Nifty 50 and Nifty IT over multiple horizons. For instance, its 5-year return stands at +243.29% versus Nifty 50’s +120.35%. This overview sets the stage for a deeper financial dive, highlighting why ETERNAL LTD is a stock to watch in 2025.
Balance Sheet Analysis
The balance sheet of ETERNAL LTD provides a snapshot of its financial health, revealing strong asset growth and equity base amid expanding liabilities. Consolidated data from March 2021 to March 2025 shows a company aggressively scaling operations while maintaining liquidity.
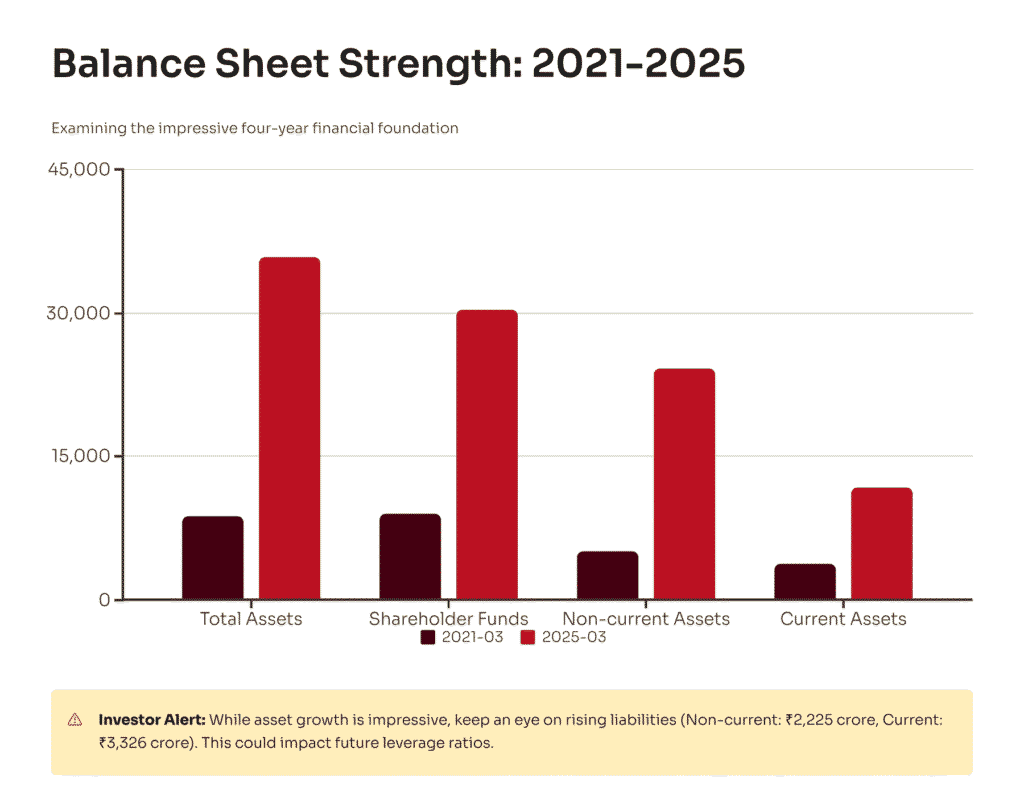
Key highlights include shareholder funds rising from ₹8,999 crore in 2021 to ₹30,317 crore in 2025, indicating robust capital raising and retained earnings. Non-current liabilities increased to ₹2,225 crore, primarily long-term borrowings for expansion. Current liabilities grew to ₹3,326 crore, reflecting operational payables.
On the asset side, non-current assets jumped to ₹24,160 crore, likely from investments in Blinkit infrastructure and technology. Current assets reached ₹11,701 crore, bolstered by cash equivalents of ₹666 crore (from cash flow data). Total assets expanded 4x to ₹35,861 crore, underscoring ETERNAL LTD’s growth trajectory.
A key ratio is the debt-to-equity, which remains low at approximately 0.18 (calculated as total liabilities / shareholder funds), signaling financial stability. However, minority interest is negative at -₹7 crore, possibly from subsidiary adjustments.
Trends over 10 years show consistent upward bars in charts for equity & liabilities and total assets, with minor dips in minority interest. This growth is fueled by quick commerce expansion, as noted in the earnings call where Albinder discussed polygon maturity driving 70% YoY growth in Delhi without new stores.
Potential risks include rising current liabilities, which could strain short-term liquidity if not managed. The current ratio (current assets / current liabilities) is about 3.52, indicating strong coverage.
Here’s a summarized table of the balance sheet data:
| Particulars | 2021-03 (Rs. Cr.) | 2022-03 (Rs. Cr.) | 2023-03 (Rs. Cr.) | 2024-03 (Rs. Cr.) | 2025-03 (Rs. Cr.) |
|---|---|---|---|---|---|
| Shh. Funds | 8,999 | 16,506 | 19,460 | 20,413 | 30,317 |
| Non Curr. Liab. | 93 | 118 | 707 | 871 | 2,225 |
| Curr. Liab. | 518 | 712 | 1,441 | 2,083 | 3,326 |
| Minority Int. | -6 | -7 | -7 | -7 | -7 |
| Equity & Liab. | 8,704 | 17,328 | 21,601 | 23,360 | 35,861 |
| Non Curr. Assets | 4,553 | 9,783 | 10,770 | 17,902 | 24,160 |
| Curr. Assets | 4,151 | 7,545 | 10,831 | 5,458 | 11,701 |
| Total Assets | 8,704 | 17,328 | 21,601 | 23,360 | 35,861 |
This table illustrates exponential growth, with shareholder funds tripling in five years. In the earnings call, Akshant Goyal highlighted inventory ownership shifts impacting the balance sheet, moving more assets on-book for better margins.
Analyzing further, ETERNAL LTD’s asset composition favors non-current investments, aligning with long-term strategies like Blinkit store expansions (visibility to 3,000 stores). Liabilities growth is controlled, with no major red flags in minority interest.
Comparatively, peers in quick commerce face higher debt burdens, but ETERNAL LTD’s equity-driven funding provides a buffer. The 10-year chart shows steady blue bars for assets, red for minority interest dips—minor in impact.
In conclusion, ETERNAL LTD’s balance sheet reflects a healthy, expanding entity poised for sustained growth, though monitoring liability trends is essential.
Cash Flow Analysis
ETERNAL LTD’s cash flow statement reveals a transition from cash-burning startup to a more mature, positive cash-generating business. Data from March 2021 to 2025 shows operational cash turning positive, with financing inflows supporting investments.
Cash from operations improved from -₹1,018 crore in 2021 to +₹308 crore in 2025, driven by profitability in food delivery and Blinkit maturation. Investing activities show outflows, peaking at -₹7,993 crore in 2025, likely for acquisitions and capex in quick commerce stores.
Financing cash was +₹8,042 crore in 2025, from equity raises. Net change in cash is +₹357 crore, with cash equivalents at ₹666 crore—providing ample liquidity.
Trends: Operational cash has red bars early, turning blue positive. Investing volatility reflects growth investments, as Albinder noted in the call: expansion in new polygons contributes <5% to growth, focus on existing areas.
Key ratio: Free cash flow (operating – capex) remains negative due to heavy investing, but improving operations suggest future positivity.
Risks: High investing outflows could strain if operations falter, but financing cushions it.
Table of cash flow data:
| Particulars | 2021-03 (Rs. Cr.) | 2022-03 (Rs. Cr.) | 2023-03 (Rs. Cr.) | 2024-03 (Rs. Cr.) | 2025-03 (Rs. Cr.) |
|---|---|---|---|---|---|
| Cash Fr. Operatn. | -1,018 | -693 | -844 | 646 | 308 |
| Cash Fr. Inv. | -5,244 | -7,938 | 457 | -347 | -7,993 |
| Cash Fr. Finan. | 6,402 | 8,750 | -127 | -207 | 8,042 |
| Net Change | 140 | 119 | -514 | 92 | 357 |
| Cash & Cash Eqvt | 307 | 392 | 218 | 309 | 666 |
This table highlights the shift to positive operations. In the call, Akshant discussed ROCE assumptions for Blinkit, with 18 days working capital—lower than peers like DMart due to efficient supply chains.
ETERNAL LTD’s cash flow supports aggressive expansion, with positive trends in operations signaling sustainability. As quick commerce matures, expect stronger free cash flows.
Profit and Loss Analysis
ETERNAL LTD’s P&L statement showcases a turnaround from losses to profitability, with net sales soaring and expenses controlled.
Net sales grew from ₹4,192 crore in 2022 to ₹23,204 crore TTM in 2025, driven by quick commerce. Other income rose to ₹1,195 crore. Total income hit ₹24,399 crore.
Expenditures at ₹22,629 crore, but PBIDT turned positive at ₹1,770 crore from -₹1,356 crore. PAT improved to ₹299 crore from -₹1,209 crore.
Trends: Red bars for early losses turn blue for profits. EPS is 0 in 2025, but adjusted EPS positive.
Key ratio: EBITDA margin at ~7.6%, improving. ROE ~1%, low but rising.
Call insights: Akshant noted MTC growth in sync with AOV, expecting continued drive.
Table:
| Particulars | 2022-03 (Rs. Cr.) | 2023-03 (Rs. Cr.) | 2024-03 (Rs. Cr.) | 2025-03 (Rs. Cr.) | 2025-06 TTM (Rs. Cr.) |
|---|---|---|---|---|---|
| Net Sales | 4,192 | 7,079 | 12,114 | 20,243 | 23,204 |
| Other Income | 514 | 725 | 881 | 1,128 | 1,195 |
| Total Income | 4,707 | 7,804 | 12,995 | 21,371 | 24,399 |
| Total Expenditure | -6,063 | -8,332 | -12,106 | -19,657 | -22,629 |
| PBIDT | -1,356 | -528 | 889 | 1,714 | 1,770 |
| Interest | -12 | -49 | -72 | -154 | -196 |
| Depreciation | -150 | -437 | -526 | -863 | -1,028 |
| Taxation | -2 | 44 | 60 | -170 | -247 |
| PAT | -1,223 | -971 | 351 | 527 | 299 |
| Consolidated Net Profit | -1,209 | -971 | 351 | 527 | 299 |
| Adjusted EPS (Rs.) | -2 | -1 | 0 | 1 | 0 |
This P&L reflects ETERNAL LTD’s path to profitability, with quick commerce as a key driver. Management’s focus on inventory ownership aims for 100bps margin boost.
Quarterly Results
Quarterly data shows steady progress. Net sales rose from ₹4,206 crore in Q4FY24 to ₹7,167 crore in Q1FY26. EBITDA at ₹115 crore, PAT at ₹25 crore.
Trends: Sales up 23% QoQ, but PAT down from ₹253 crore due to seasonal factors.
Table:
| Particulars | Q4FY24 (Rs. Cr.) | Q1FY25 (Rs. Cr.) | Q2FY25 (Rs. Cr.) | Q3FY25 (Rs. Cr.) | Q1FY26 (Rs. Cr.) |
|---|---|---|---|---|---|
| Net Sales | 4,206 | 4,799 | 5,405 | 5,833 | 7,167 |
| Expenditure | 4,029 | 4,573 | 5,243 | 5,761 | 7,052 |
| EBITDA | 177 | 226 | 162 | 72 | 115 |
| Other Income | 236 | 221 | 252 | 368 | 354 |
| Depreciation | 149 | 180 | 247 | 287 | 314 |
| Interest | 25 | 30 | 43 | 56 | 67 |
| PBT | 239 | 237 | 124 | 97 | 88 |
| Tax | -14 | 61 | 65 | 58 | 63 |
| PAT | 253 | 176 | 59 | 39 | 25 |
| Adjusted EPS (Rs.) | 0.29 | 0.20 | 0.07 | 0.04 | 0.03 |
Call discussion: Contribution margins flat, but Adjusted EBITDA improved 60bps due to leverage.
Technical Indicators
ETERNAL LTD’s technicals indicate overbought conditions with bullish momentum. RSI (Daily) at 70.62 (overbought), CCI at 120.64 (overbought). Stochastic %K at 85.24 (bullish).
Relative strength positive across benchmarks. ADX at 38.74 (trending).
Table:
| Indicator | Value | Zone |
|---|---|---|
| Relative Strength Index (Daily) | 70.62 | Overbought |
| Relative Strength Index (Weekly) | 68.48 | Neutral |
| Commodity Channel Index | 120.64 | Overbought |
| Money Flow Index | 30.05 | Neutral |
| Rate of Change | 3.87 | Positive |
| Stochastic %K | 85.24 | Bullish |
| Williams %R | -4.46 | Overbought |
| Average Directional Index | 38.74 | Trending |
These suggest potential pullback but strong uptrend.
Performance Metrics
ETERNAL LTD outperforms peers: +1.94% (1D), +5.52% (1W), +47.41% (6M), +243.29% (5Y) vs. Nifty 50’s +120.35%.
Charts show green bars for long-term gains, red for short-term dips in sector.
Call: Outperformed despite competition.
Earnings Call Highlights
The Q1FY26 earnings call on July 21, 2025, featured Akshant Goyal, Albinder Singh Dhindsa, and Kunal Swarup. Key themes: Quick commerce growth, competition, inventory shift.
Ankur Rudra queried on Blinkit growth: Albinder noted secular category growth, 70% YoY in Delhi from existing polygons.
On competition: Akshant said they’ll react to maintain leadership.
Manish Adukia on inventory: Plan to move most to 1P in 2-3 quarters for margin benefits.
Industry size: Growth high for next 2 years, visibility to 3,000 stores.
Aditya Soman on ROCE: 18 days working capital due to efficient supply chain.
Swapnil Potdukhe on users: Unique quick commerce users increasing.
Vivek Maheshwari on 1P shift: Improves margins, operational metrics.
Gaurav Rateria on leadership: KPIs not disclosed.
Vijit Jain on AOV: Rising long-term, seasonal fluctuations.
Rishi Jhunjhunwala on NOV slowdown: Due to MTC, expect recovery.
Sachin Salgaonkar on models: No megapods, focus on 15-min delivery.
These highlights show strategic confidence.
Future Outlook and Investment Advice
ETERNAL LTD’s outlook is positive, with quick commerce driving growth. Target 3,000 stores, margin expansion to 2.5% in mature cities.
Risks: Competition, GLP-1 impacts.
Advice: Buy for long-term, target ₹400+ in 12 months based on trends.
Conclusion
ETERNAL LTD stands as a compelling investment, blending growth and profitability. Monitor updates for continued success.
Disclaimer: This blog post is for informational purposes only and does not constitute financial advice. Investing in the stock market involves risks, and you should consult a financial advisor before making investment decisions.
