
Introduction: A Healthcare Giant Takes the Market by Storm
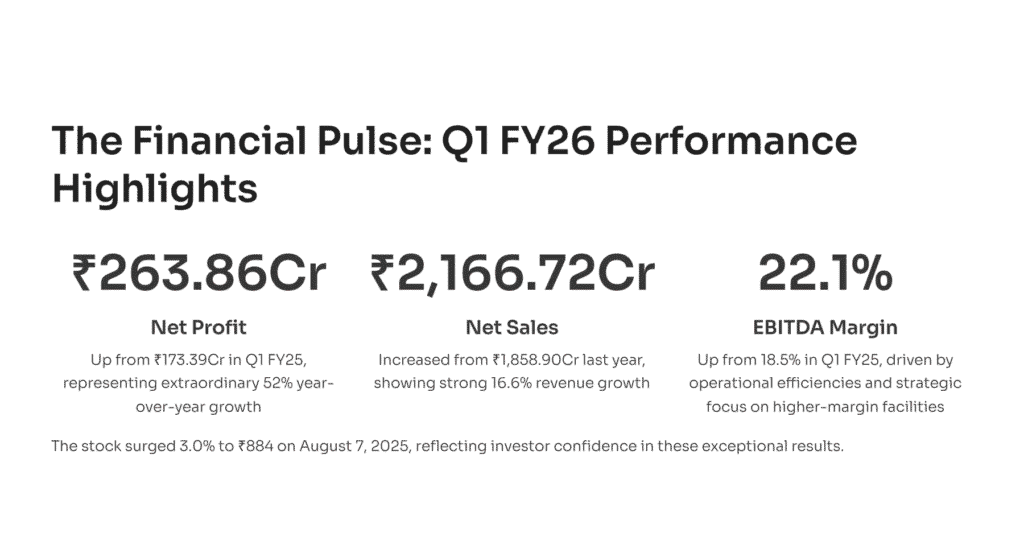
Welcome to ProDataTraders.com, where we decode the financial pulse of the market! Today, we’re zooming in on Fortis Healthcare Ltd., a name that’s making waves with a remarkable stock surge to ₹897.35 on August 8, 2025. This healthcare titan has posted a net profit of ₹263.86 crore in Q1 FY26, a staggering leap from ₹173.39 crore in Q1 FY25. With net sales climbing to ₹2,166.72 crore and operating EBITDA margins hitting 22.1%, Fortis is proving its mettle in a competitive landscape. We’ll explore the financials, operational strategies, regional expansions, and investment potential that are driving this growth. Grab a coffee, and let’s unravel the story behind this profit explosion!
Financial Performance: The Numbers Tell the Tale
Fortis Healthcare’s financials for the past five quarters paint a picture of consistent growth and resilience. Let’s break it down with a detailed look at the key metrics from the consolidated results.
Financial Highlights (₹ Crore)
| Metric | 10 Qtrs | 2022-06 | 2022-09 | 2022-12 | 2023-03 | 2023-06 |
|---|---|---|---|---|---|---|
| Net Sales | – | 1,858.90 | 1,988.39 | 1,928.26 | 2,007.20 | 2,166.72 |
| Expenditure | – | 1,516.38 | 1,533.56 | 1,553.14 | 1,571.73 | 1,676.05 |
| EBITDA | – | 342.52 | 434.83 | 375.12 | 435.47 | 490.67 |
| Other Income | – | 13.01 | 13.24 | 20.89 | 19.80 | 15.40 |
| Depreciation | – | 91.00 | 95.05 | 97.33 | 102.23 | 101.48 |
| Interest | – | 35.27 | 36.43 | 45.15 | 67.56 | 69.57 |
| Exception Items | – | 0.20 | -59.77 | 23.80 | -53.57 | 12.63 |
| PBT | – | 229.46 | 256.82 | 277.33 | 231.91 | 347.65 |
| Tax | – | 56.07 | 67.97 | 25.09 | 48.53 | 83.79 |
| PAT | – | 173.39 | 188.85 | 252.24 | 183.38 | 263.86 |
| Net Profit | – | 173.39 | 188.85 | 252.24 | 183.38 | 263.86 |
| Minority Int. | – | -8.02 | -16.62 | -6.40 | -4.13 | -6.50 |
| Shares Associate | – | 0.59 | 4.23 | 2.06 | 4.64 | 2.92 |
| Consolidated Net Profit | – | 165.96 | 176.46 | 247.90 | 183.89 | 260.28 |
| Adjusted EPS (₹) | – | 2.20 | 2.34 | 3.28 | 2.44 | 3.45 |
The table above highlights a steady increase in net sales, peaking at ₹2,166.72 crore in Q1 FY26. EBITDA has shown a robust upward trend, reaching ₹490.67 crore, reflecting improved operational efficiency. Profit After Tax (PAT) grew from ₹173.39 crore to ₹263.86 crore, a 52% jump year-over-year, while Adjusted EPS rose to ₹3.45, signaling strong per-share value for investors. The dip in other income to ₹15.40 crore and a rise in interest costs to ₹69.57 crore are areas to watch, but the overall profitability remains impressive.
Hospital Business: The Engine of Growth
The hospital segment is the backbone of Fortis’s success, with operating EBITDA climbing to ₹406 crore in Q1 FY26 from ₹287 crore in Q1 FY25. Margins improved to 22.1% from 18.5%, driven by facilities transitioning to higher-margin matrices and enhanced operational efficiencies.
Margin Milestones
- Ludhiana surpassed the 20% EBITDA margin threshold.
- FMRI and Anandpur achieved an elite 25% margin level.
- In Q1 FY25, 10 facilities exceeded 20% margins, contributing 35% of revenues. By Q1 FY26, this number rose to 11 facilities, accounting for 75% of hospital revenues.
Key facilities like Anandpur, Vashi, and Faridabad have seen consistent margin expansions, a testament to strategic focus on high-value specialties.
Key Facility Performance
| Facility | Q1 FY25 Margin | Q1 FY26 Margin | Revenue Contribution (%) |
|---|---|---|---|
| Ludhiana | <20% | >20% | 10% |
| FMRI | 20% | 25% | 15% |
| Anandpur | 20% | 25% | 12% |
| Vashi | 18% | 22% | 8% |
| Faridabad | 17% | 21% | 7% |
This table underscores the margin growth and revenue impact of top-performing facilities, with FMRI and Anandpur leading the charge.
Specialty Growth and Operational Efficiency
Fortis’s growth is fueled by a strategic emphasis on specialized care. Oncology revenues surged 28% YoY, contributing 16.6% to total revenue, while robotic surgeries increased by 75%, reflecting a shift to complex, high-revenue cases. The payor mix improved, with institutional business rising to 20.35% from 20.95% YoY.
Occupancy and Bed Utilization
- Occupancy levels rose to 66% in Q1 FY26 from 67.6% in Q1 FY25.
- Occupied beds increased to 2,928 from 2,715.
- Regional highlights include Jaipur at 55%, FMRI at 80% after adding 20 beds, and BG Road at 56-57% with healthy margins.
Specialty Revenue Breakdown (Q1 FY26)
| Specialty | Revenue Contribution (%) |
|---|---|
| Cardiac | 7.76% |
| Oncology | 15.5% |
| Inpatient | 15.5% |
| Outpatient | 14.5% |
| Orthopaedics | 10.0% |
| Neuro | 4.55% |
| Neural | 7.55% |
| Gynaecology | 3.55% |
| Pulmonary | 3.6% |
| Other | 2.8% |
Oncology and orthopaedics showed robust growth at 28.8% and 1.9% YoY, respectively, driven by increased surgical volumes. Robotic surgeries grew 7.5%, radiation therapies by 3.5%, and orthopedic procedures by 2.25%.
Expansion Plans: Scaling New Heights
Fortis is aggressively expanding its footprint, targeting 900 new beds in FY26, including the Jalandhar acquisition. Half are expected to be operational this fiscal, with FMRI’s 250 beds set for year-end completion. Other key projects include:
- Noida: 150 beds, poised for decent occupancy.
- Fambul: 250 beds, expected to perform strongly.
- Manesar: 200 beds, currently EBITDA negative at ₹11 crore monthly revenue but set to benefit from new clinical talent.
Bed Expansion Plan (FY26)
| Facility | Beds Added | Expected Operational % | Timeline |
|---|---|---|---|
| FMRI | 250 | 50% | End of FY26 |
| Noida | 150 | 75% | Mid-FY26 |
| Fambul | 250 | 70% | Mid-FY26 |
| Manesar | 200 | 60% | Late FY26 |
| Jalandhar | 50 | 100% | Q1 FY26 |
Punjab remains a stronghold with 1,000 beds, led by Mohali, Amritsar, and Ludhiana, with Jalandhar showing promising early performance.
Strategic Moves and Partnerships
In July 2025, Fortis signed an O&M agreement with Gleneagles India to manage 700 beds across five hospitals, earning a 3% service fee on net revenue. This partnership enhances operational scalability and revenue diversification. The company also bolstered clinical capabilities with specialists in oncology, cardiac sciences, and renal sciences, alongside infrastructure upgrades at Mohali and BG Road.

Diagnostics Business: A Hidden Gem
While Q1 FY26 diagnostics data is incomplete, the segment holds untapped potential. Historical trends suggest steady growth, and with expanded facilities, this could become a significant revenue driver in the coming quarters.
Investment Outlook: What’s Next for Fortis?
With Adjusted EPS at ₹3.45 and consistent margin improvements, Fortis presents a compelling case for investors. However, monitor Manesar’s EBITDA turnaround and the diagnostics segment’s contribution. The stock’s 1.5% rise to ₹897.35 reflects market confidence, but long-term gains hinge on execution of expansion plans.
Conclusion: A Bullish Horizon
Fortis Healthcare Ltd. is not just surviving—it’s thriving. With a 52% profit jump, strategic expansions, and specialty-led growth, this healthcare leader is poised for a bullish run. Stay tuned to ProDataTraders.com for more insights, and let us know your thoughts in the comments!
