
INOX India, a leading player in the cryogenic equipment manufacturing sector, has been making waves in the stock market with its robust performance and strategic positioning in high-growth areas like industrial gases, LNG, and cryo-scientific applications. As a stock market analyst at ProDataTraders.com, I’ve delved deep into the latest Q1 FY26 results, technical indicators, and market trends to provide you with a comprehensive breakdown. Whether you’re a long-term investor eyeing sustainable growth or a trader looking for short-term opportunities, this analysis of INOX India stock will equip you with the insights needed to make informed decisions. With the company’s revenue climbing 17% YoY and a massive order backlog signaling future potential, INOX India is emerging as a standout in India’s industrial equipment landscape.
We’ll explore everything from INOX India’s company fundamentals to its financial health, segment performance, technical signals, and future prospects. We’ll also incorporate key data tables for easy reference and highlight risks to ensure a balanced view. If you’re searching for “INOX India stock analysis” or “INOX India Q1 FY26 results,” you’ve come to the right place. Let’s dive in!
Understanding INOX India: Company Overview and Business Model
INOX India, listed on NSE as INOXINDIA and BSE as 544046, is a pioneer in cryogenic solutions with over 30 years of experience in designing, manufacturing, and installing equipment for industrial gases, LNG, and cryo-scientific divisions. The company serves a global customer base across more than 100 countries, with large-scale manufacturing facilities in India (four locations), Brazil (part manufacturing and service), and the Netherlands (stock and sale). This international footprint has helped INOX India achieve a resilient revenue mix, with exports contributing 56% in Q1 FY26.
At its core, INOX India’s business revolves around cryogenic tanks, systems for storage, distribution, and transportation of gases like oxygen, nitrogen, argon, hydrogen, and CO2. The company’s vision is to be the world’s best integrated cryogenic solutions enterprise, exceeding customer expectations through innovation and quality. This is reflected in its product range, which spans from standard vertical tanks and microbulk units to advanced LNG fuel stations and cryo-preservation systems.
Key business divisions include:
- Industrial Gases (IG): The largest segment, contributing 48% to revenue in Q1 FY26. It includes storage tanks, vaporizers, and microbulk units for applications in healthcare, steel, petrochemicals, and more. Despite US tariffs impacting disposable cylinders (down 9.5% YoY), the segment showed resilience with new orders in ultra-high purity ammonia ISO containers and CO2 battery projects.
- LNG: Accounting for 29% of revenue, this division saw a staggering 121% YoY growth in Q1 FY26, driven by supplies to OEMs and regulatory tailwinds. Products include LNG fuel tanks, marine fuel systems, and mini-LNG terminals. The company is scaling production to 5,000-6,000 units annually, with plans for 30,000-40,000 in 3-5 years.
- Cryo Scientific: Contributing 19% to revenue, this segment focuses on high-tech applications like fusion energy (ITER project) and space (ISRO tenders). A key highlight was the Rs 145 crore order for Cryostat Thermal Shield repair.
INOX India’s growth is underpinned by a strong order backlog of Rs 1,457 crore as of June 30, 2025 (up 32% YoY), with 63% from exports. This diversification across geographies (North America 32%, Europe 23%, South America 14%) and sectors minimizes risks and positions the company for sustained expansion.
The management, led by Chairman Pavan Jain (50+ years in chemical engineering) and CEO Deepak Acharya (joined 1992), emphasizes engineering excellence and clean energy initiatives in LNG, liquid hydrogen, and fusion. With a team of 450+ engineers, INOX India focuses on product development ahead of demand, such as liquid hydrogen tanks and cryogenic propulsion systems.
Financially, the company maintains a debt-free balance sheet with Rs 275 crore in cash equivalents, enabling capex of Rs 80 crore in FY26 for expansions at Kandla, Kalol, and Savli plants. Shareholding is promoter-dominated at 75%, with DIIs at 6.68% and FPIs at 6.94% as of June 2025. This structure supports long-term value creation, as evidenced by a 34% RoCE and 26% RoE in FY25.
INOX India’s IPO in December 2023 raised funds for capacity enhancement, solidifying its “Make in India, Make for the World” ethos. As India’s economy grows at 6.5% in 2025, with exports surging 76% to $825 billion, INOX India is well-aligned with sectors like engineering goods and clean energy.
In-Depth Analysis of Q1 FY26 Financial Results
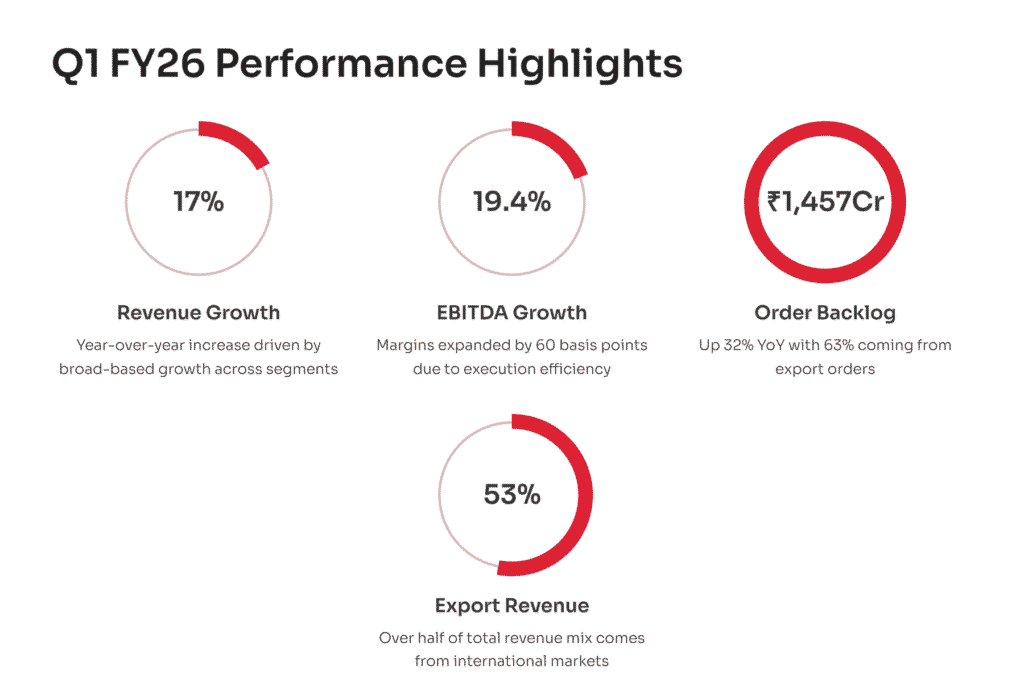
INOX India’s Q1 FY26 results, announced on August 4, 2025, showcased strong growth despite challenges like US tariffs. Consolidated revenue from operations rose 15% YoY to Rs 340 crore, with total income up 16.7% to Rs 352 crore, including other income of Rs 12.7 crore (up 136% YoY from reversals and interest). EBITDA increased 19.4% to Rs 89 crore, with margins expanding 60 basis points to 25.1%. Profit after tax (PAT) jumped 18.9% to Rs 61 crore, achieving a 17.3% margin.
Here’s a detailed table summarizing the consolidated profit and loss for Q1 FY26 compared to previous periods:
| Particulars (Rs Cr) | Note | Q1 FY26 | % | Q1 FY25 | % | Y-o-Y | Q4 FY25 | % | Q-o-Q | FY25 | % |
|---|---|---|---|---|---|---|---|---|---|---|---|
| Revenue from Operations | 339.6 | 296.4 | 14.6% | 369.4 | -8.1% | 1,306.0 | |||||
| Other Income | 1 | 12.7 | 5.4 | 136.1% | 13.1 | -3.6% | 47.8 | ||||
| Total Income | 352.3 | 301.8 | 16.7% | 382.5 | -7.9% | 1,353.8 | |||||
| Cost of materials consumed | 143.4 | 40.7% | 113.67 | 37.7% | 26.2% | 182.1 | 47.6% | -21.3% | 586.1 | 43.3% | |
| Changes in Inventories of FG & SFG | (8.7) | -2.5% | 18.0 | 6.0% | -148.0% | (25.9) | -6.8% | -66.5% | (9.1) | -0.7% | |
| Total Cost of materials consumed including WIP | 2 | 134.8 | 38.3% | 131.7 | 43.6% | 2.3% | 156.3 | 40.9% | -13.8% | 577.0 | 42.6% |
| Employee benefits expense | 3 | 33.9 | 9.6% | 26.2 | 8.7% | 29.5% | 29.4 | 7.7% | 15.3% | 110.0 | 8.1% |
| Other expenses incl Other Comprehensive Income | 4 | 95.2 | 27.0% | 69.8 | 23.1% | 36.3% | 101.9 | 26.6% | -6.5% | 336.6 | 24.9% |
| Total Operating Expenses | 263.8 | 74.9% | 227.7 | 75.5% | 15.9% | 287.5 | 75.2% | -8.2% | 1,023.6 | 75.6% | |
| EBITDA (with Other Income) | 88.5 | 25.1% | 74.08 | 24.5% | 19.4% | 95.0 | 24.8% | -6.9% | 330.3 | 24.4% | |
| EBITDA Margin (%) | 25.1% | 24.5% | 0.6% | 24.8% | 0.3% | 24.4% | |||||
| Finance cost | 5 | 0.7 | 0.2% | 2.0 | 0.7% | -64.5% | 1.2 | 0.3% | -38.2% | 8.5 | 0.6% |
| Depreciation | 7.6 | 2.1% | 5.6 | 1.9% | 35.0% | 7.1 | 1.9% | 6.0% | 25.1 | 1.9% | |
| Profit Before Tax (PBT) | 80.2 | 22.8% | 66.4 | 22.0% | 20.7% | 86.7 | 22.7% | -7.5% | 296.6 | 21.9% | |
| Tax Expense | 6 | 19.2 | 5.5% | 15.2 | 5.0% | 26.6% | 20.87 | 5.5% | -7.8% | 72.7 | 5.4% |
| Profit After Tax (PAT) | 60.9 | 17.3% | 51.2 | 17.0% | 18.9% | 65.8 | 17.2% | -7.5% | 224.0 | 16.5% | |
| PAT Margin (%) | 17.3% | 17.0% | 0.3% | 17.2% | 0.1% | 16.5% |
The quarter-on-quarter decline (revenue down 8% from Q4 FY25) is attributed to seasonal factors and tariff impacts, but YoY growth remains solid. Material costs rose 26.2% YoY due to higher volumes, but efficient inventory management led to a negative change in inventories, keeping total material costs in check. Employee expenses increased 29.5% YoY to Rs 33.9 crore, reflecting additions for the Savli plant ramp-up.
Balance sheet highlights include a net cash position of Rs 548 crore (up from Rs 516 crore in March 2025), with no gross debt. Inventory rose to Rs 555 crore, driven by work-in-progress for large orders. Trade receivables increased to Rs 200 crore, but management expects collections to improve.
| Consolidated Balance Sheet – Key Summary Figures | June-25 (End Rs Cr) | Mar-25 (End Rs Cr) |
|---|---|---|
| Sources of Funds | ||
| Share Capital | 18 | 18 |
| Other Equity | 899 | 856 |
| Total Equity | 917 | 874 |
| Gross Debt | – | – |
| Other Non Current | 27 | 29 |
| Total Sources of Funds | 944 | 902 |
| Application of Funds | ||
| Fixed Assets Incl (CWIP & Capital Advance) | 381 | 379 |
| Other Non-current Assets | 16 | 7 |
| Total Non Current Assets (Non CA) | 396 | 386 |
| Current Assets | ||
| RM Incl Stores & Spares | 344 | 288 |
| WIP/FG | 211 | 205 |
| Total Inventory | 555 | 493 |
| Trade Receivables | 200 | 252 |
| Net Cash & Bank bal, Mutual Fund & FDR | 275 | 261 |
| Contract Assets (net of Contract Liabilities) | 221 | 126 |
| Other Current Assets | 69 | 56 |
| Total Current Assets (CA) | 1,321 | 1,187 |
| Current Liabilities | ||
| Trade Payables including Expenses Payable | 148 | 138 |
| Other Current Liabilities | 481 | 481 |
| Total Current Liabilities (CL) | 773 | 672 |
| Net Current Assets : NCA (=CA-CL) | 548 | 516 |
| Total Application of Funds (Non CR + NCA) | 944 | 902 |
RoE stood at 26.72% (annualized), and RoCE at 34.56%, underscoring efficient capital utilization. The company’s guidance for 18-20% revenue growth in FY26, with EBITDA growing slightly higher, appears achievable given the Rs 1,457 crore order backlog.
Compared to FY25’s full-year revenue of Rs 1,354 crore and PAT of Rs 224 crore, Q1 FY26 represents ~26% of annual revenue, aligning with seasonal trends where Q1 is typically slower.
Breaking Down Segment-Wise Performance: Where the Growth Is Coming From
INOX India’s diversified segments drove Q1 FY26 performance, with LNG stealing the show.
Industrial Gases: Revenue at Rs 170 crore (down 9.5% YoY due to US tariffs on steel components), but order inflow of Rs 184 crore (44% of total) signals recovery. Key wins include India’s first ultra-high purity ammonia ISO containers for semiconductors/solar (certified by DNV) and a CO2 battery storage project from an Italian firm. Management notes limited tariff impact as INOX India is one of few US suppliers, with new approvals for helium and R32 cylinders adding opportunities. This segment’s backlog is Rs 654 crore (45% of total).
LNG: Explosive growth with revenue at Rs 102 crore (121% YoY), contributing 29% to total. Supplied ~145 fuel tanks to OEMs, with production streamlining and regulatory changes (LNG allowed in mobile pressure vessels per SMPV rules) boosting demand. Awards at Financial Express Mobility for LNG tanks and sustainability underscore leadership. Capacity expansion underway to scale from current levels to 30,000-40,000 units in 3-5 years. Backlog: Rs 469 crore (32%).
Cryo Scientific: Revenue at Rs 67 crore (up from Rs 13 crore YoY), with Rs 146 crore order inflow (35%). Secured Rs 145 crore ITER Cryostat Thermal Shield repair order (90% in-house). Confident in winning FAIR (Germany) and ISRO tenders. Backlog: Rs 334 crore (23%).
Order inflow table:
| Segment | Q1 FY26 (Rs Cr) | % of Total | Q1 FY25 (Rs Cr) | Y-o-Y Growth |
|---|---|---|---|---|
| Industrial Gases | 184 | 45% | 142 | 29.6% |
| LNG | 85 | 20% | 88 | -3.4% |
| Cryo Scientific | 146 | 35% | 80 | 82.5% |
| Total | 415 | 100% | 310 | 33.9% |
Exports dominated at 55% of orders, up from 51% YoY. The LNG segment’s surge aligns with India’s natural gas demand projection of 2030-2040 by PNGRB, emphasizing small-scale LNG as a “next big wave.” Cryo Scientific benefits from fusion energy momentum, with ITER and ISRO as key drivers.
Beverage kegs, a nascent area, saw orders of Rs 6.4 crore (up from Rs 2 crore), with global approvals from Heineken and AB InBev. Targeting 100,000 kegs in FY26, ramp-up expected post additional audits (Asahi, Carlsberg).
Overall, segments are poised for growth, with management guiding higher EBITDA than revenue due to execution efficiency and pricing discipline.
Technical Analysis: Decoding the Charts for INOX India Stock
As of August 22, 2025, INOX India stock closed at Rs 1,152.00, up 0.04% from the previous day. Technical indicators suggest a neutral to positive bias, with potential for upside if momentum builds.
Here’s a table of key indicators:
| Category | Indicator | Value | Zone |
|---|---|---|---|
| Momentum | Relative Strength Index (Daily) | 50.48 | Neutral |
| Relative Strength Index (Weekly) | 51.97 | Neutral | |
| Commodity Channel Index | 12.96 | Neutral | |
| Money Flow Index | 46.07 | Neutral | |
| Rate of Change | 2.87 | Positive | |
| Stochastic %K | 66.07 | Neutral | |
| William %R | -24.22 | Neutral | |
| Relative Strength | Relative Strength Benchmark Index (21 Days) | -0.05 | Negative |
| Relative Strength Benchmark Index (55 Days) | -0.07 | Negative | |
| Relative Strength Benchmark Index (21 Weeks) | 0.09 | Positive | |
| Static Relative Strength | 0.17 | Positive | |
| Adaptive Relative Strength | -0.21 | Negative | |
| Relative Strength Sector Index (55 Days) | -0.07 | Negative | |
| Trend | Average Directional Index | 26.25 | Trending |
| Moving Average Convergence/Divergence | -20.64 | Negative | |
| Volatility | Average True Range | 36.61 | – |
| Bollinger Band Width | 0.13 | – | |
| Bollinger Band %B | 0.61 | – | |
| Beta – Benchmark Index | 0.74 | – | |
| Beta – Sectoral Index | 0.72 | – | |
| Standard Deviation | 29.40 | – |
The RSI (daily at 50.48, weekly at 51.97) hovers around neutral, indicating neither overbought nor oversold conditions. The ADX at 26.25 signals a trending market, potentially bullish if it breaks above 30. MACD is negative at -20.64, suggesting bearish momentum in the short term, but Rate of Change at 2.87 is positive.
Volatility metrics like ATR (36.61) and Bollinger Band Width (0.13) show low volatility, with the stock trading in the upper band (%B at 0.61). Beta values (0.74 benchmark, 0.72 sectoral) indicate lower volatility than the market, making it a stable pick.
From a chart perspective, the stock has support at Rs 1,100-1,120 and resistance at Rs 1,200. A breakout above Rs 1,157 (recent high) could target Rs 1,230, aligning with analyst price targets implying 18.6% upside. Recent stock performance shows a 1.11% gain on August 21, with 5 consecutive up days, but a 4.5% drop post-results on August 5 reflects initial tariff concerns.
For traders, monitor the 50-day SMA at Rs 1,138 for support. Long-term investors can accumulate on dips, given the “Overweight” rating and reasonable valuation at 29x FY28 earnings.
Future Outlook: Growth Drivers and Market Opportunities for INOX India
INOX India’s future looks promising, with management guiding 18-20% top-line growth for FY26, driven by LNG adoption, cryo-scientific projects, and IG resilience. The order backlog provides visibility for 1-1.5 years, with execution ramp-up expected in H2 FY26.
Key growth drivers:
- LNG as ‘Winner Fuel’: With regulatory support (LNG in mobile vessels) and OEM demand, INOX India is set to benefit from India’s natural gas push. Projections show demand rising to 2030-2040, with small-scale LNG gaining traction for islands and remote areas. Capacity expansions will support scaling to 30,000+ fuel tanks.
- Cryo Scientific Momentum: Rs 145 crore ITER order and upcoming FAIR/ISRO tenders (potentially Rs 4,000 crore for ISRO’s third launch pad, with 20% cryogenic share) position INOX for high-margin wins. Fusion energy and space sectors offer long-term potential.
- Industrial Gases Expansion: High-purity applications (ammonia for semiconductors, CO2 batteries) and exports (despite tariffs) will drive 15-17% growth. New products like helium cylinders add incremental revenue.
- Clean Energy Initiatives: Focus on hydrogen, CO2 storage, and data center cryogenic cooling aligns with global trends. Partnerships (e.g., Adani for LNG ecosystem) enhance reach.
- Financial Strength: Debt-free status, Rs 275 crore cash, and 24.4% EBITDA margins enable Rs 80 crore capex without dilution. RoCE at 34% supports efficient growth.
Market outlook: India’s GDP growth (6.3-6.8% in FY26) and export surge bolster demand. Global cryogenic market growth (driven by LNG, semiconductors) favors INOX’s “Made in India” edge. Analysts rate “Buy” with 18.6% upside, trading at 29x FY28 EPS – reasonable for 19% 3Y CAGR.
However, Q1 stock dip (4.5% post-results) highlights volatility; recent recovery to Rs 1,152 shows resilience.
Risks and Challenges: What Could Go Wrong for INOX India?
While optimistic, INOX India faces risks:
- Tariff and Trade Barriers: US tariffs on steel components impacted IG (9.5% decline). Escalation could affect 10-12% of revenue from disposable cylinders.
- Execution Delays: Large projects (e.g., ITER) span 2 years; delays in Savli plant stabilization or capex could hit margins.
- Competition: Global players like Chart Industries (recently acquired by Baker Hughes) intensify rivalry in LNG/data centers.
- Regulatory Changes: LNG adoption depends on policies; slowdown in station additions (only 45 operational vs. 1,000 target) is a concern.
- Volatility in Inputs: Steel price fluctuations could pressure 40.7% material costs.
- Market Risks: Economic slowdowns or lower natural gas demand projection misses could impact order inflows.
Mitigations include diversification (56% exports), innovation, and strong liquidity. Technicals show mild bullishness, but MACD negativity warrants caution.
Conclusion: Is INOX India a Buy? Final Thoughts for Investors
INOX India stands out as a high-growth stock in India’s cryogenic sector, with Q1 FY26 results validating its trajectory: 17% revenue growth, 121% LNG surge, and Rs 1,457 crore backlog. Technicals are neutral-positive, suggesting accumulation on dips. For long-term holders, the 18-20% guidance, clean energy focus, and reasonable valuations make it a potential multibagger. Traders can watch for breakouts above Rs 1,157.
At ProDataTraders.com, we rate INOX India “Buy” for portfolios targeting industrial growth. Stay tuned for updates – subscribe for more analyses!
Disclaimer: The views and investment tips expressed by experts on ProdataTraders.com are their own and not those of the website or its management. ProdataTraders advises users to check with certified experts before taking any investment decisions.
