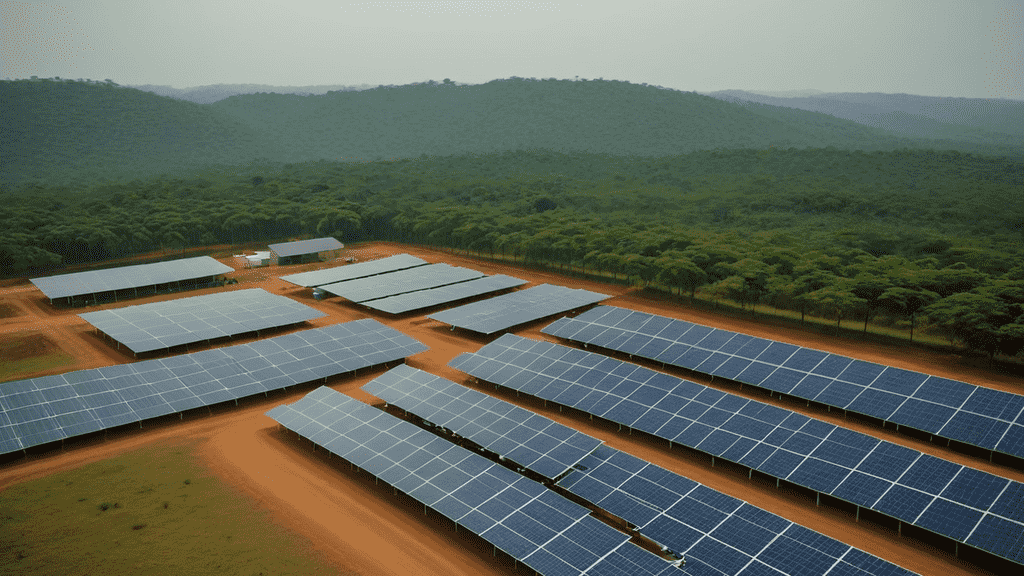
1. Introduction: Waaree Energies – A Solar Powerhouse Redefining Energy Transition
Waaree Energies Limited (NSE: WAAREEENER) has emerged as India’s leading solar module manufacturer, with a staggering ₹47,000 Cr order book and a 300% YoY profit surge in FY25. This blog dissects its explosive growth, strategic bets on green hydrogen and U.S. manufacturing, and how it plans to dominate the $1.3 trillion global renewable energy market by 2030.
Key Highlights:
- FY25 Revenue: ₹14,846 Cr (+27.6% YoY).
- EBITDA Margin: 21.04% (up from 15.56% in FY24).
- Order Book: ₹47,000 Cr (54% international, 46% domestic).
- Capacity Expansion: 15 GW modules, 5.4 GW cells, and 3.5 GWh battery storage by 2027.
2. Financial Performance Deep Dive
2.1 Revenue & Profit Analysis
Waaree’s FY25 consolidated revenue soared to ₹14,846 Cr, driven by robust demand in India’s utility-scale solar projects and U.S. exports. PAT skyrocketed 254% YoY to ₹1,928 Cr, fueled by operational efficiency and favorable input costs.
| Metric | FY24 | FY25 | Growth (%) |
|---|---|---|---|
| Revenue (₹ Cr) | 11,633 | 14,846 | 27.6% |
| EBITDA (₹ Cr) | 1,810 | 3,123 | 72.6% |
| PAT (₹ Cr) | 933 | 1,932 | 107.1% |
| EBITDA Margin (%) | 15.56% | 21.04% | +5.48 pts |
Data Insight: The 72.6% EBITDA jump reflects cost optimization, backward integration into cells, and premium pricing in the U.S. market.
2.2 Balance Sheet & Cash Flow
- Cash Reserves: ₹509 Cr (up 320% YoY).
- Debt Management: Debt-to-equity ratio improved to 0.21 (vs. 0.87 in FY23).
- Capex Surge: ₹6,808 Cr invested in capacity expansion and acquisitions.
| Cash Flow (₹ Cr) | FY24 | FY25 |
|---|---|---|
| Operating Activities | 2,305 | 3,158 |
| Investing Activities | -3,340 | -6,808 |
| Financing Activities | 909 | 4,036 |
Strategic Takeaway: Aggressive capex positions Waaree for long-term growth but raises execution risks.
3. Strategic Expansion: Manufacturing, Acquisitions, and Global Dominance
3.1 U.S. Manufacturing: The IRA Gambit
- Texas Facility: Operational since Jan 2025, targeting 3 GW module capacity by 2026.
- Margin Boost: U.S. modules command 30–35% higher pricing (vs. 17–18 cents/W in India).
Management Quote (Amit Pathankar, CEO):
“Our U.S. factory is a crown jewel. We’re structured to thrive with or without IRA incentives.”
3.2 Backward Integration: Cells, Wafers, and Ingots
- 5.4 GW Cell Capacity: Pilot production started in Q4 FY25; full ramp-up by 2026.
- 6 GW PLI Project: Govt-backed ingot-wafer facility in Odisha to reduce China dependency.
3.3 Green Hydrogen & Energy Storage
- Electrolyser PLI: 300 MW facility approved; SECI bid won for 90,000 tons of green hydrogen.
- Battery Storage: 3.5 GWh plant under construction (operational by FY27).
Strategic Edge: Vertical integration from modules to storage ensures margin control across the value chain.
4. Market Leadership: India’s Solar Champion vs. Global Competitors
4.1 Domestic Dominance
- Market Share: 14.1% of India’s module shipments (highest in FY25).
- Policy Tailwinds: ALMM mandate and PM Surya Ghar Yojana drive DCR demand.
| India Solar Capacity | 2025 | 2030 (Projected) |
|---|---|---|
| Installed (GW) | 105+ | 280+ |
| Waaree’s Order Share | 16.5 GW | 25–30 GW |
4.2 Global Footprint
- Exports: 21% of FY25 revenue (U.S., Middle East, Europe).
- Tier-1 Ranking: BNEF Tier 1 for 38 consecutive quarters.
Competitor Snapshot:
| Metric | Waaree | Tata Power Solar | First Solar |
|---|---|---|---|
| Module Capacity | 15 GW | 4 GW | 20 GW |
| EBITDA Margin (%) | 21.04 | 18.2 | 24.5 |
5. Sustainability & Innovation
5.1 EcoVadis Gold & Net-Zero Goals
- EcoVadis Score: 79/100 (97th percentile).
- Net-Zero Target: Scope 1 & 2 by 2030; Scope 3 by 2040.
5.2 Technology Leadership
- HJT Modules: 730 Wp modules with BIS certification.
- R&D Collaboration: Partnership with IIT-Bombay for next-gen cells.
Quote from Concall:
“Our modules have the lowest carbon footprint in India. Sustainability is our USP.” – Sonal Shrivastava, CFO.
6. Risk Analysis
6.1 Policy Dependence
- ALMM Changes: Cell inclusion by 2026 may strain supply chains.
- U.S. IRA Uncertainty: 54% order book exposed to policy shifts.
6.2 Execution Risks
- Capex Overhang: ₹15,550 Cr allocated for FY26–27 projects.
- Chinese Equipment Reliance: Visa delays and geopolitical tensions.
Mitigation Strategy: Diversifying suppliers and pre-booking cell capacity.
7. Technical Analysis
7.1 Stock Performance
- Price (23 Apr 2025): ₹3,007.70 (+137% YoY).
- Valuation: PE 46.25 (Industry PE: 59.14).
| Indicator | Value | Implication |
|---|---|---|
| Bollinger Band %B | 1.31 | Overbought Territory |
| Standard Deviation | 236.09 | High Volatility |
Technical Takeaway: Short-term correction likely, but long-term uptrend intact.
8. Conclusion: Buy, Sell, or Hold?
Strengths:
- Dominant market share in India’s solar boom.
- Vertical integration and global diversification.
Risks:
- Policy volatility and execution delays.
Verdict: Buy for long-term investors. Target price: ₹3,800 (26% upside).
Disclaimer: This blog post is for informational purposes only and should not be construed as investment advice. Please consult with a financial advisor before making any investment decisions.


